

There is not much change from yesterday. Bitcoin had another re-test of the prior high at $4360 with no success of breaking. Then, a reversal movement back to re-test the critical level of $4200.
As we mentioned in our previous analysis this week – Bitcoin is moving sideways between $4200 – $4500, that currently tightens up to $4200 and $4360.
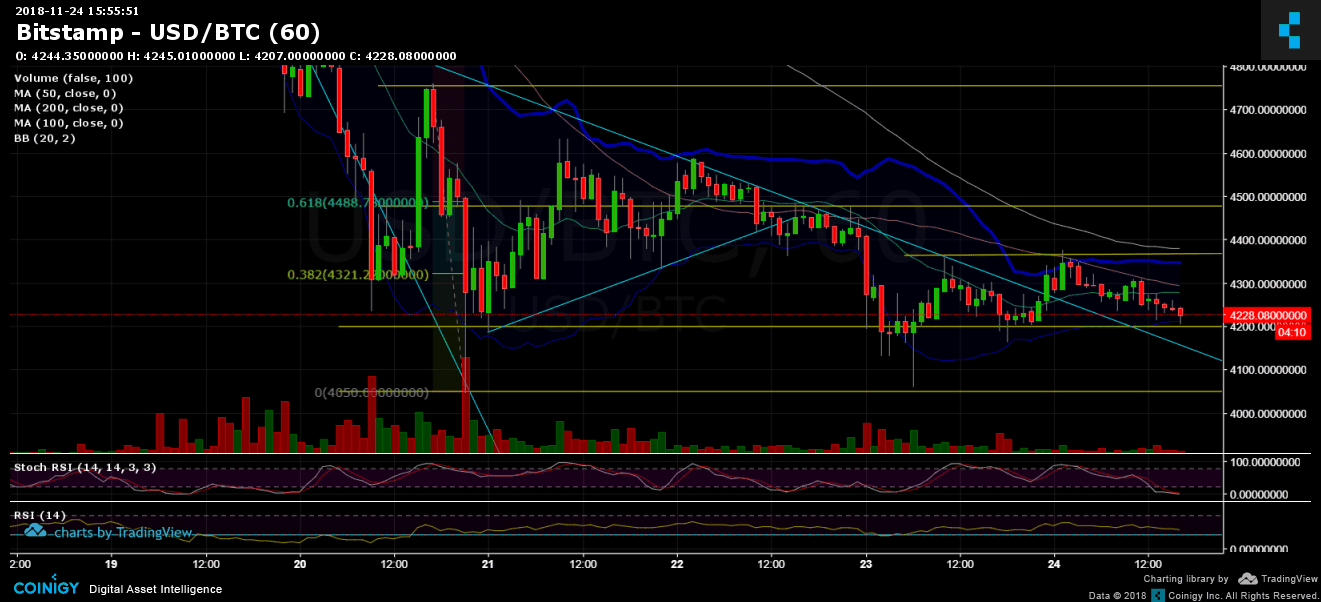
Looking at the 1-day chart & 1-hour chart:
- The big picture hadn’t changed much – a bull scenario of creating a double bottom at the $4050 level, or a bear scenario in breaking the above level. As mentioned above, the sideways movement is between $4200 and $4360. There is a little support at around $4100 (descending trend-line), that might also prevent Bitcoin from creating new yearly lows.
- Bollinger bands are shrinking. This indicates of a possible major move coming up soon.
- In case of breaking the yearly low at $4050, the next major support lies at $3700 area. The next significant support area lies at $3000.
- From above, support-turned resistance levels at $4280 (50 days moving average), $4360, $4500 and $4750.
- Looking at the hourly chart, Stochastic RSI is about to cross in the oversold level. As of writing this, it hadn’t happened yet.
- The trading volume has decreased significantly, typically to weekends and in anticipation for the next big move.
- BitFinex open short positions are at 26.4K, another decline from yesterday.
BTC/USD BitStamp 1-Hour chart
Cryptocurrency charts by TradingView. Technical analysis tools by Coinigy.
Disclaimer: Information found on CryptoPotato is those of writers quoted. It does not represent the opinions of CryptoPotato on whether to buy, sell, or hold any investments. You are advised to conduct your own research before making any investment decisions. Use provided information at your own risk. See Disclaimer for more information.


