

What can be said? very red and sad weekend for the crypto markets. But, remember by looking at the market cycles famous chart, bear trends are to be changed only after the stage of “capitulation”. That happens when everyone gives up, when you notice everyone on Twitter have lost their hope in Bitcoin, that’s when we can start seeing signs of reversal and smart money accumulating. To my opinion, there are some first signs of capitulation. The only disadvantage is that it can go much lower before Bitcoin will get back to the uptrend track.
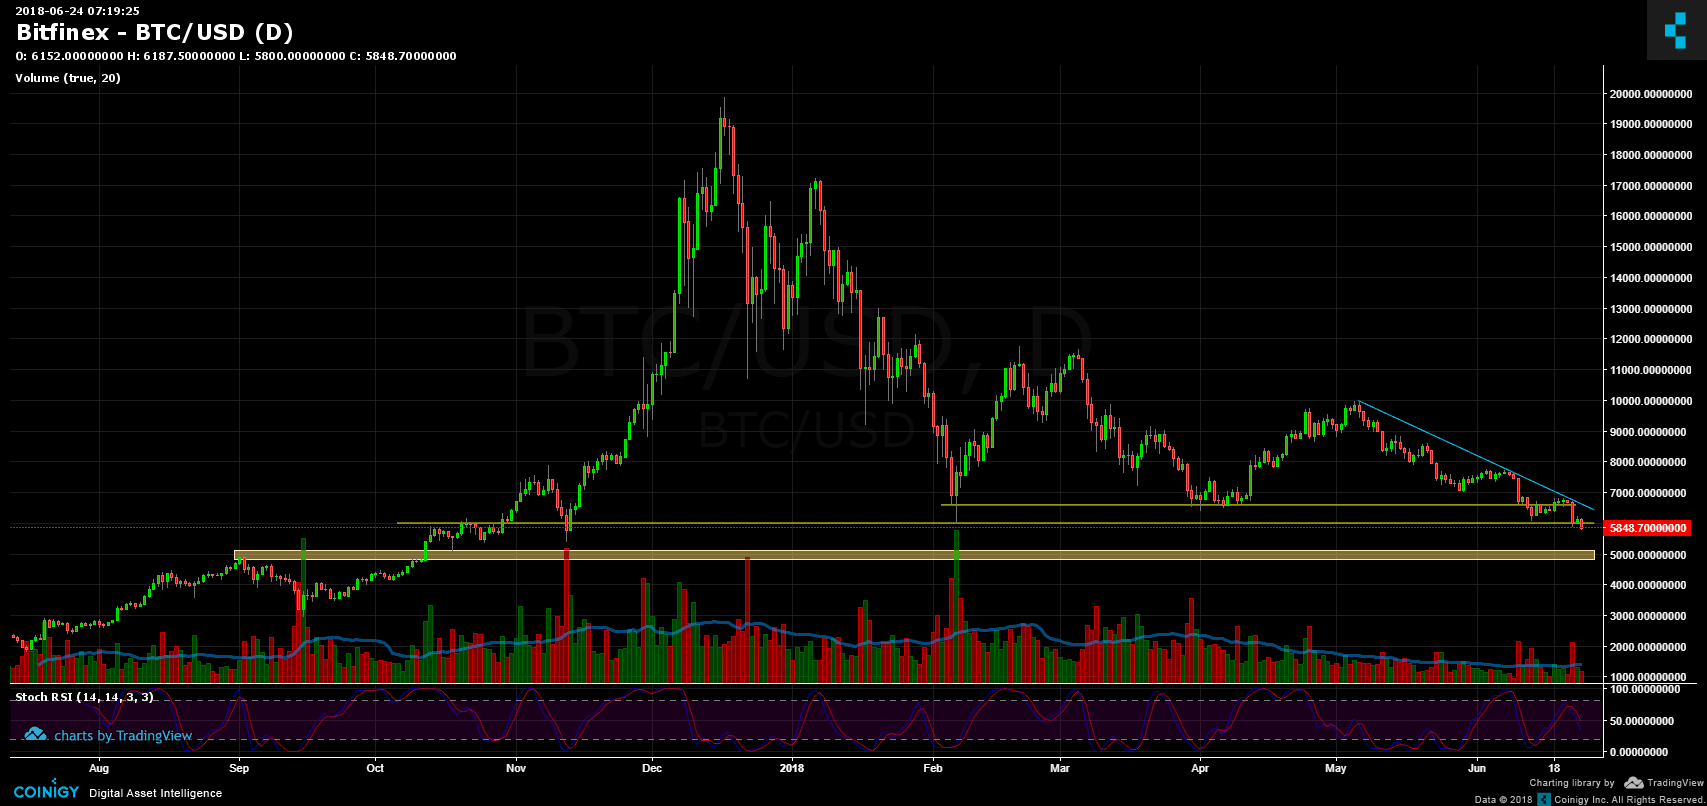
By looking at the 1 day chart, we can see that we are testing the famous 2018 yearly low from February 6 at around $5,900. Last time it ended with a nice rebound to $11,800 zone. This time? the next major area of support lies between $4,800 to $5,200. We’ll watch this area closely. From the bull side, the descending trend line (light blue) at around $6,400 and also the area of $6,600 that has now became a very tough resistance. Indicators show that the market is oversold after this red weekend. It wouldn’t surprise me to see a possible little correction before continue down.
BTC/USD BitFinex 1 Day chart
Cryptocurrency charts by TradingView
Disclaimer: Information found on CryptoPotato is those of writers quoted. It does not represent the opinions of CryptoPotato on whether to buy, sell, or hold any investments. You are advised to conduct your own research before making any investment decisions. Use provided information at your own risk. See Disclaimer for more information.


