

Over the past 7 days, Bitcoin has been trading between $7800 to $8400. The recent days the range is more $7800 to $8200. Seems like a triangle has been built in the BTC chart and is expecting to produce a fast move to either direction, this is expected to take place in the following 1-2 days.
RSI levels are very low, which is a positive sign (market is oversold). Also, the strong support at $7800 seems to hold. From the negative aspect, the last sell-off candle was followed by a massive amount of volume.
From the previous analysis, the range stays pretty much the same:
To sum up: Support levels lie at $7800, $7600 and $7300.
Resistance levels lie at $8200, $8400 and $9000 (which is our closest target to current bull run).
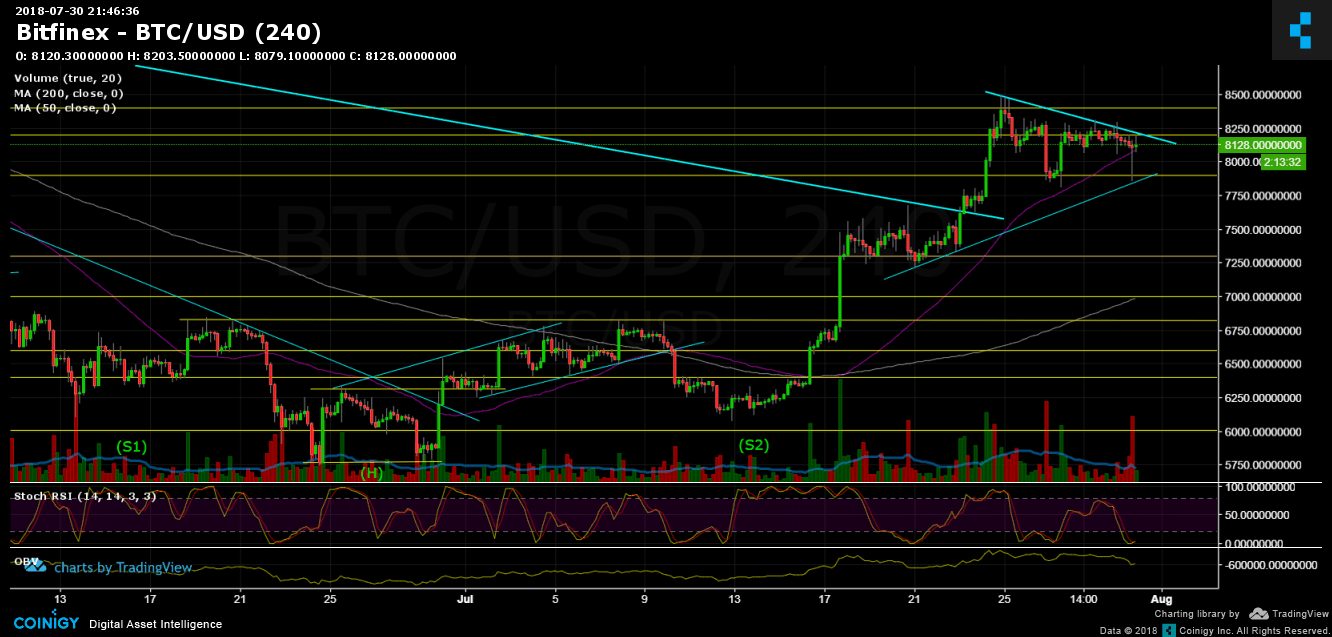
Bitcoin Prices: BTC/USD BitFinex 4 Hours chart
Disclaimer: Information found on CryptoPotato is those of writers quoted. It does not represent the opinions of CryptoPotato on whether to buy, sell, or hold any investments. You are advised to conduct your own research before making any investment decisions. Use provided information at your own risk. See Disclaimer for more information.


