

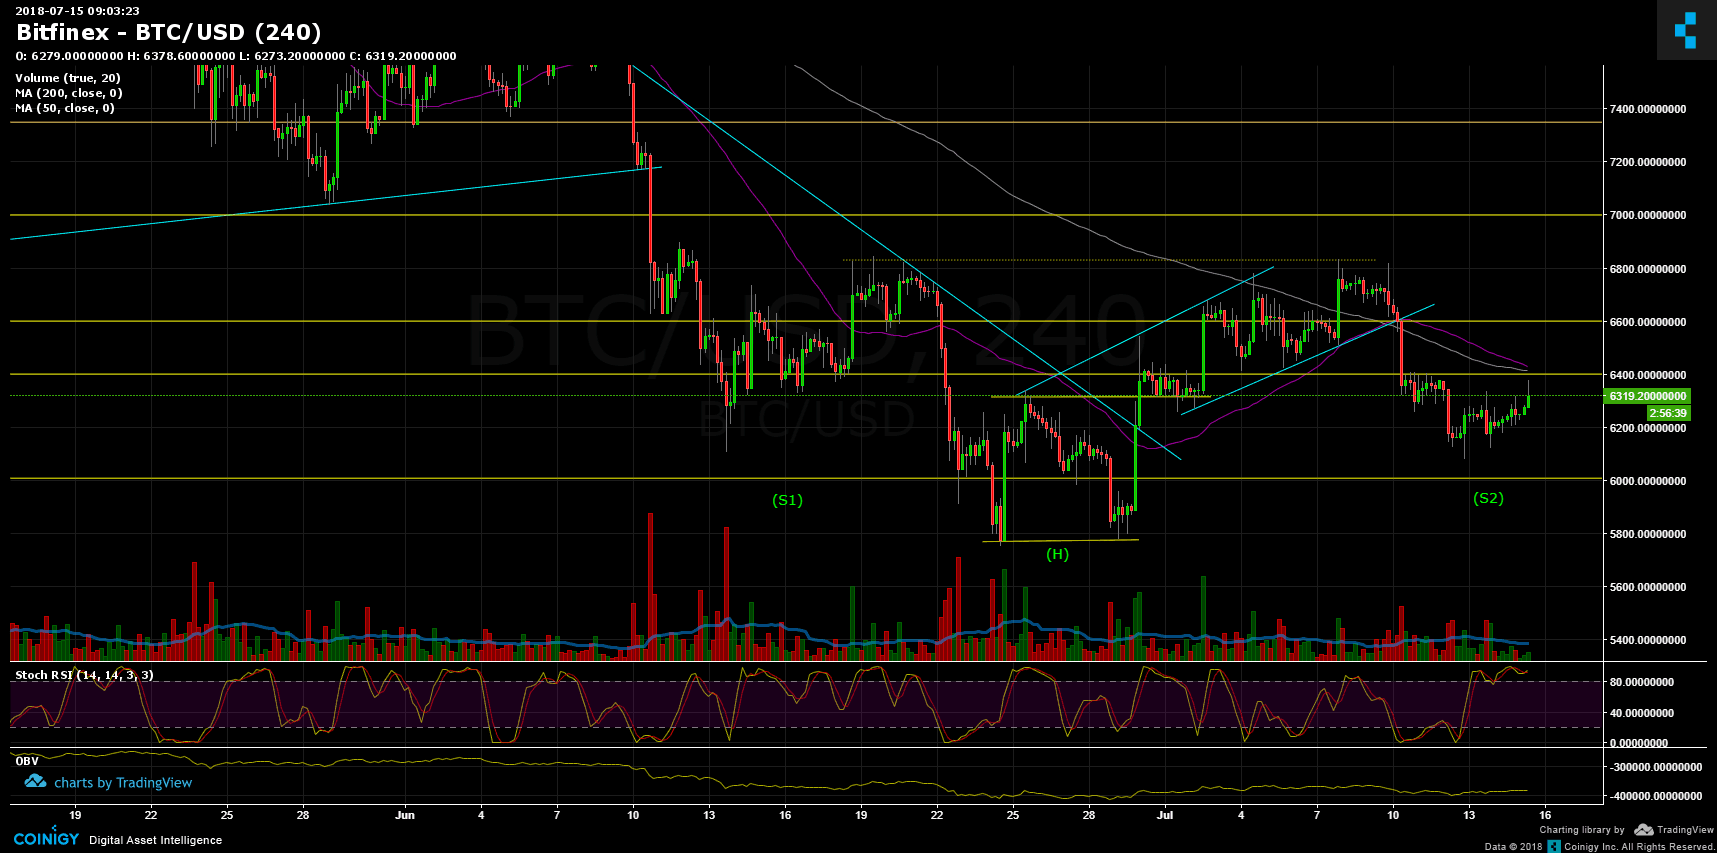
Following our previous Bitcoin price analysis, the formation of an inverse Head and Shoulders pattern is still alive, keeping the ‘low’ of the shoulders at around $6100.
As of now, though resistance level at $6400 – including the resistant line along with Moving average 50 days and 200 days (pink and purple lines). Afterwards, the $6600 resistance line lies, and the major $6800, which is critical for the H&S pattern.
From the bear side, $6130~ and $6000 are the nearest support lines.
Bitcoin Prices: BTC/USD BitFinex 4 Hours chart
Disclaimer: Information found on CryptoPotato is those of writers quoted. It does not represent the opinions of CryptoPotato on whether to buy, sell, or hold any investments. You are advised to conduct your own research before making any investment decisions. Use provided information at your own risk. See Disclaimer for more information.


