

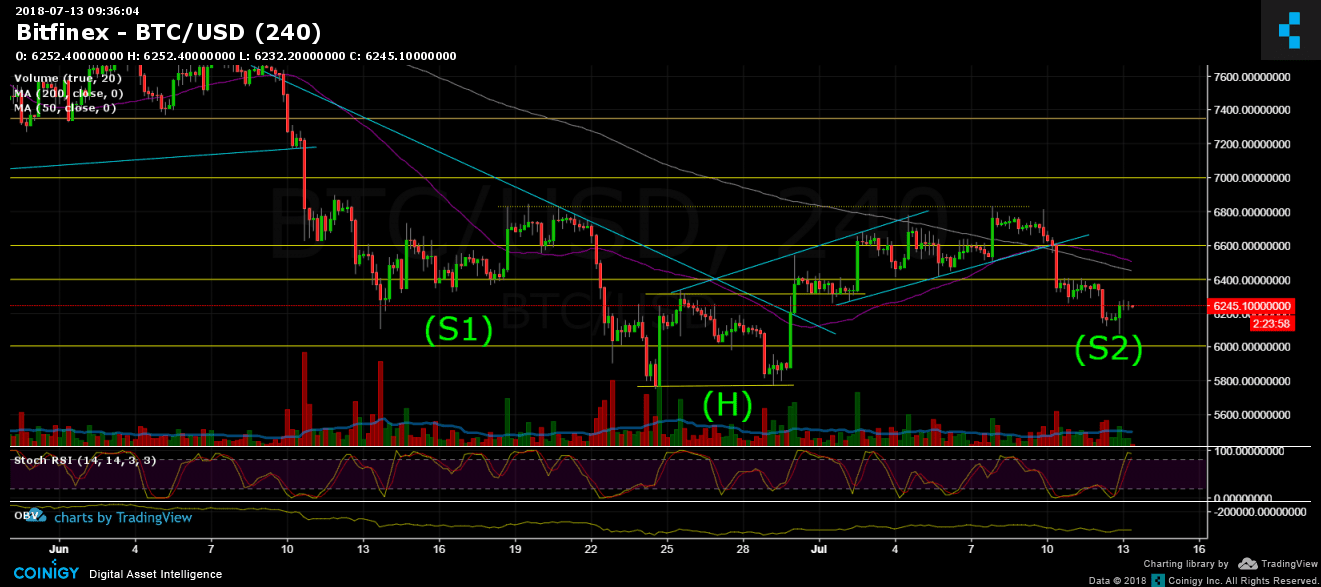
Continue the way down on the last day of the week. Bitcoin has tested the $6000 support level that seems to hold (so far). Now facing support-turned resistance at $6300. RSI levels are very high, means market is overbought, market might need some air before trying to break the resistance.
There might be a bullish scenario of an inverse Head (H) and Shoulders pattern. As you can see on the chart below, BTC might be building now the right shoulder (S2). This pattern will be valid in case of breaking $6800 in around a week. The pattern can be canceled any time by a whale, so as far as it looks now – it doesn’t look so optimistic.
To sum up: Strong support lies at $6000, and $5800. Resistance area $6300 – $6400, $6600 and $6800.
BTC/USD BitFinex 4 Hours chart
Disclaimer: Information found on CryptoPotato is those of writers quoted. It does not represent the opinions of CryptoPotato on whether to buy, sell, or hold any investments. You are advised to conduct your own research before making any investment decisions. Use provided information at your own risk. See Disclaimer for more information.


