

Not much had changed since our previous BTC price analysis from yesterday: Bitcoin is still consolidating in the tight range of $3500 to $3600.
This move was followed by a low amount of volume, and it looks like that Bitcoin is seeking to find its next direction.
Looking at the 1-day & 4-hour charts
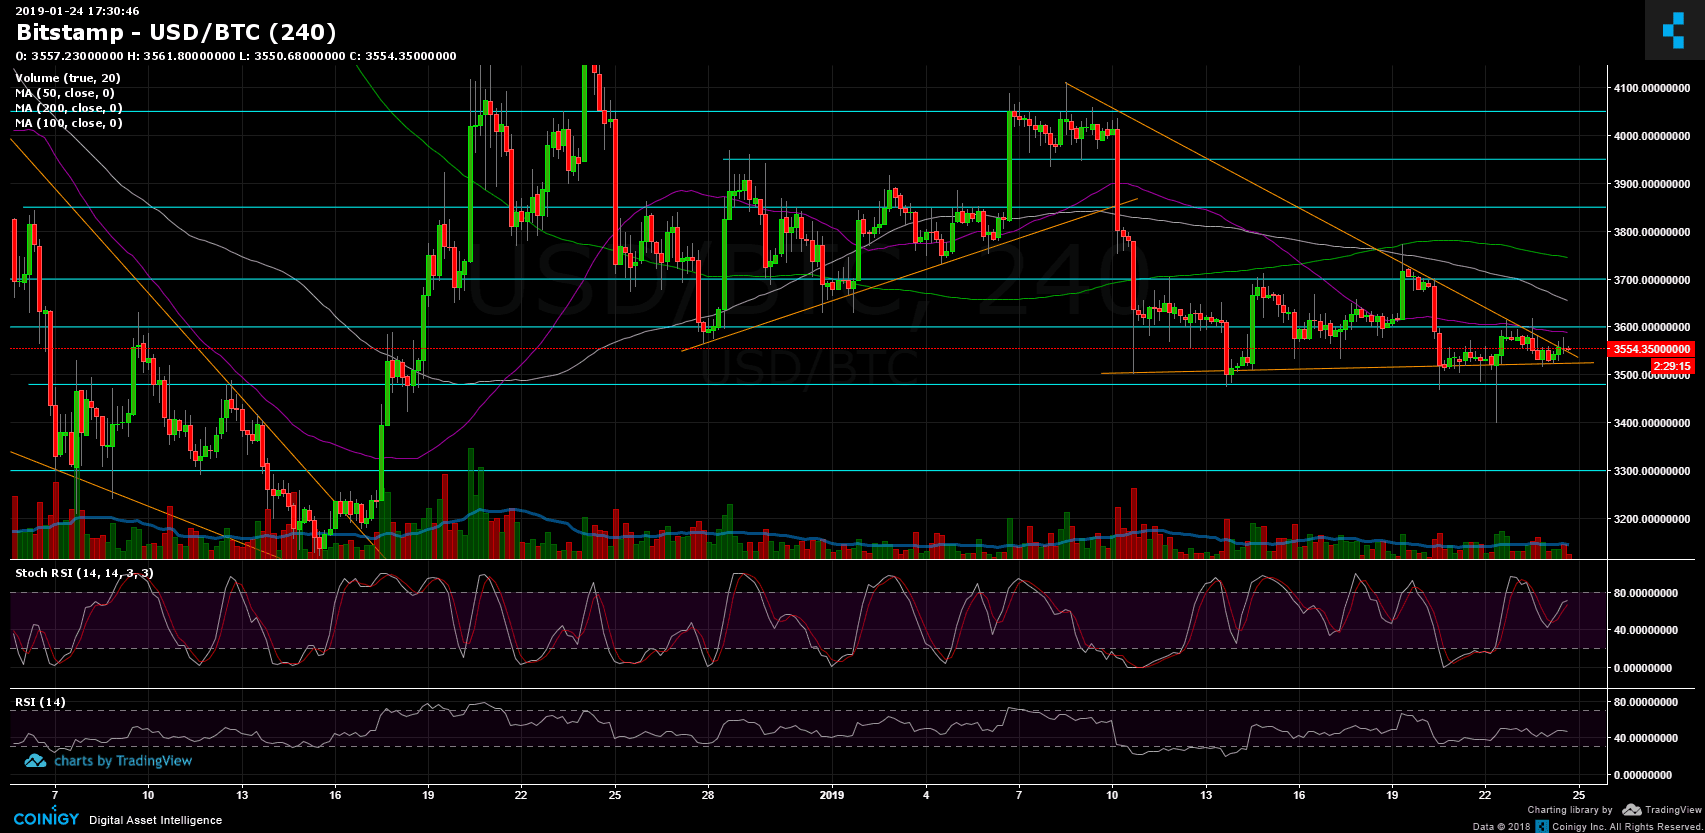
- Bitcoin is attempting to break out the descending trend-line (marked in orange on the 4-hour chart). However, a breakout should also include the $3600 resistance area and a higher amount of volume.
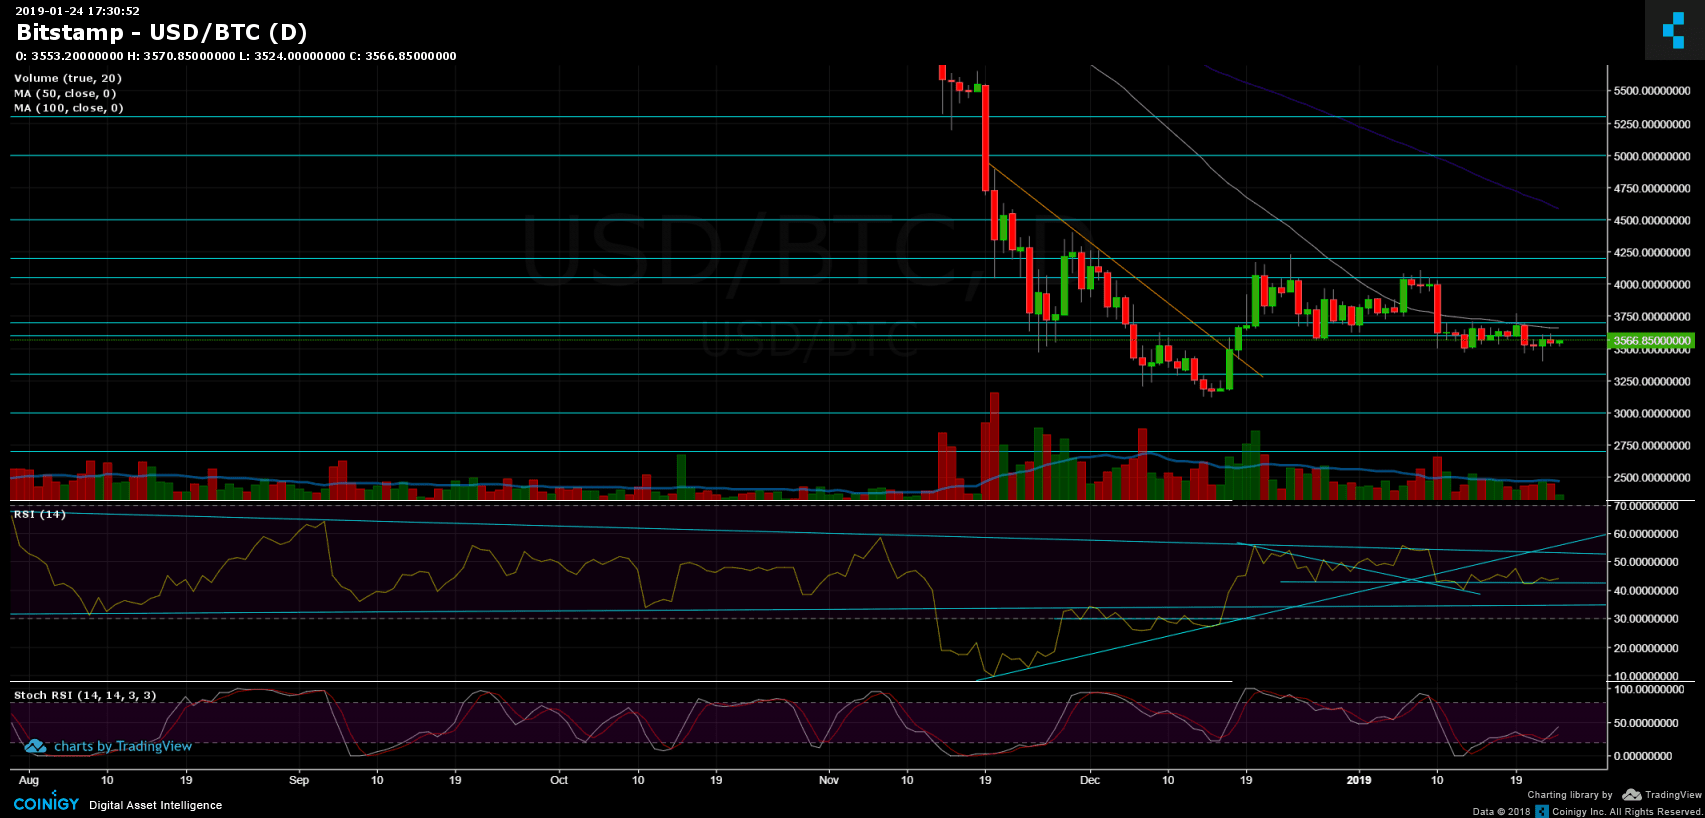
- In case of breaking up the $3600, along with the 50-days moving average line (4-hour chart), the next targets might be the daily chart’s 50 days moving average line (marked in white, currently around $3650), next targets are the $3700 and $3800 areas.
- From the bear side, the closest support is around $3530 – the ascending trendline marked in orange, followed by the significant support area at the $3480 – $3500. Below this level, lies the $3400 (weak support) and $3300 support level. This is before retesting the 2018 low at $3120.
- The daily chart’s RSI: Currently hovering healthy above the supporting line at 43. The 4-hour chart’s RSI is getting close to the overbought area.
- As mentioned above, the trading volume is low while BTC seeks to find its next destination.
- BitFinex’s open short positions increased to 23.7K BTC of open positions, yet not a significant amount.
BTC/USD BitStamp 4-Hour chart
BTC/USD BitStamp 1-Day chart
Disclaimer: Information found on CryptoPotato is those of writers quoted. It does not represent the opinions of CryptoPotato on whether to buy, sell, or hold any investments. You are advised to conduct your own research before making any investment decisions. Use provided information at your own risk. See Disclaimer for more information.
Cryptocurrency charts by TradingView.


