

Following the negative sentiment which started yesterday, we’ve seen Bitcoin continue down to re-test the critical support at $3600. As we mentioned, the sharp decline could be anticipated, by looking at the number of shorts vs longs. What led to a long-squeeze.
It’s incredible how gains of two weeks were gone in just 10 hours, as said before: Bulls Walk Up the Stairs-Bears Jump Out the Window.
So far it seems that a correction is needed, and there is a large demand around this level. However, the situation is very fragile.
Looking at the 1-day & 4-hour charts
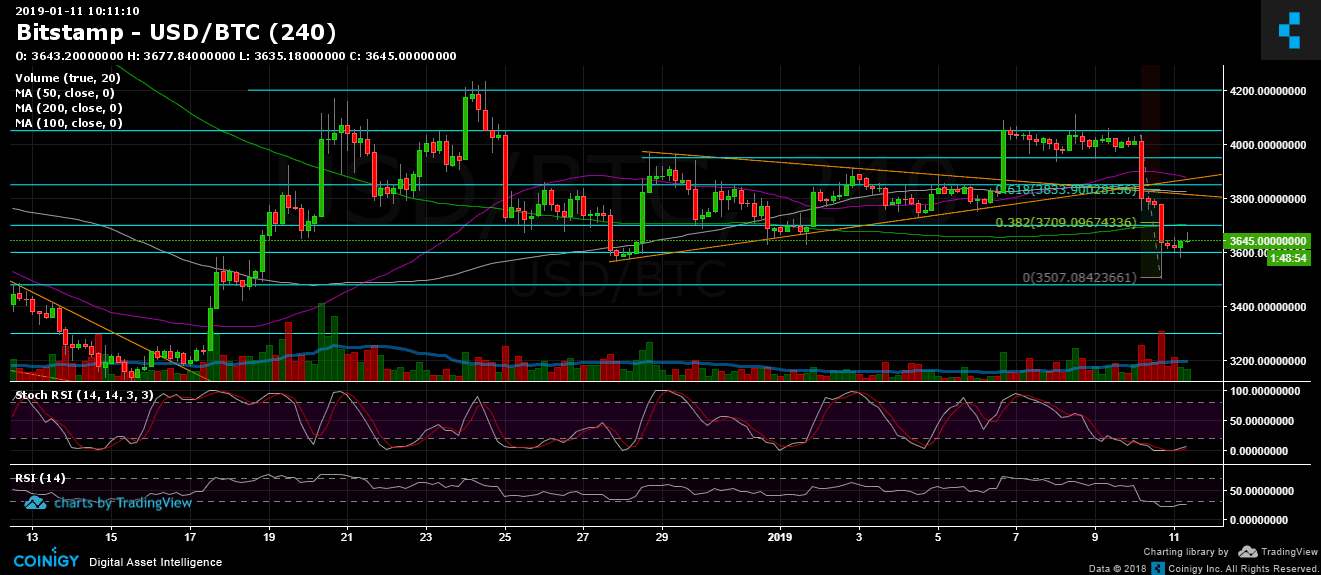
- The next support levels are at $3600 (current area), and $3480 – $3500. The last is a crucial support zone. Breaking it down could lead Bitcoin to discover new lows hadn’t seen yet in 2018. Breaking down the $3500 could lead Bitcon quickly to re-test $3300 support.
- The 4-hour Stochastic RSI oscillator had crossed over around the oversold area. We can say, with caution, that a correction could take place. Possible targets could be the significant support turned resistance $3700 (along with 200 days moving average line and Fibb retracement level 38.2% of the last decline), or even $3800.
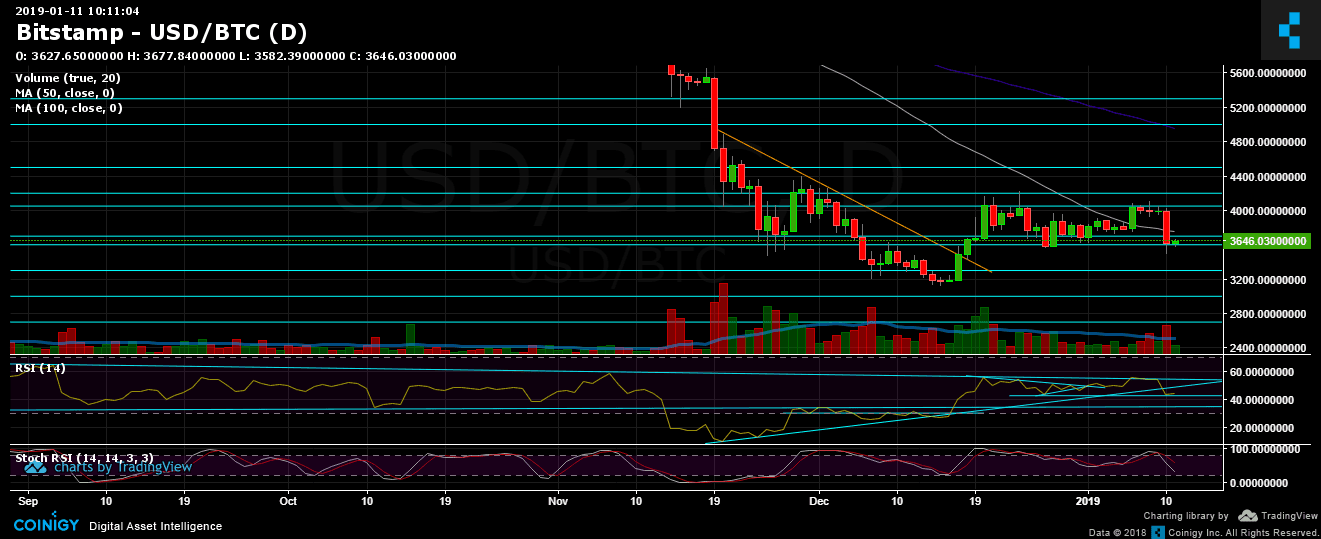
- The Daily Chart: The RSI level had broken down the long-term descending trend-line, and as of now it seems that support around RSI level 42 holds.
- Trading volume: Yesterday’s daily volume is the highest level since December 21. That teaches us that the sellers are still around and still active.
- As expected, BitFinex’s open short positions increased drastically to 24.5K.
BTC/USD BitStamp 4-Hour chart
BTC/USD BitStamp 1-Day chart
Disclaimer: Information found on CryptoPotato is those of writers quoted. It does not represent the opinions of CryptoPotato on whether to buy, sell, or hold any investments. You are advised to conduct your own research before making any investment decisions. Use provided information at your own risk. See Disclaimer for more information.
Cryptocurrency charts by TradingView.


