

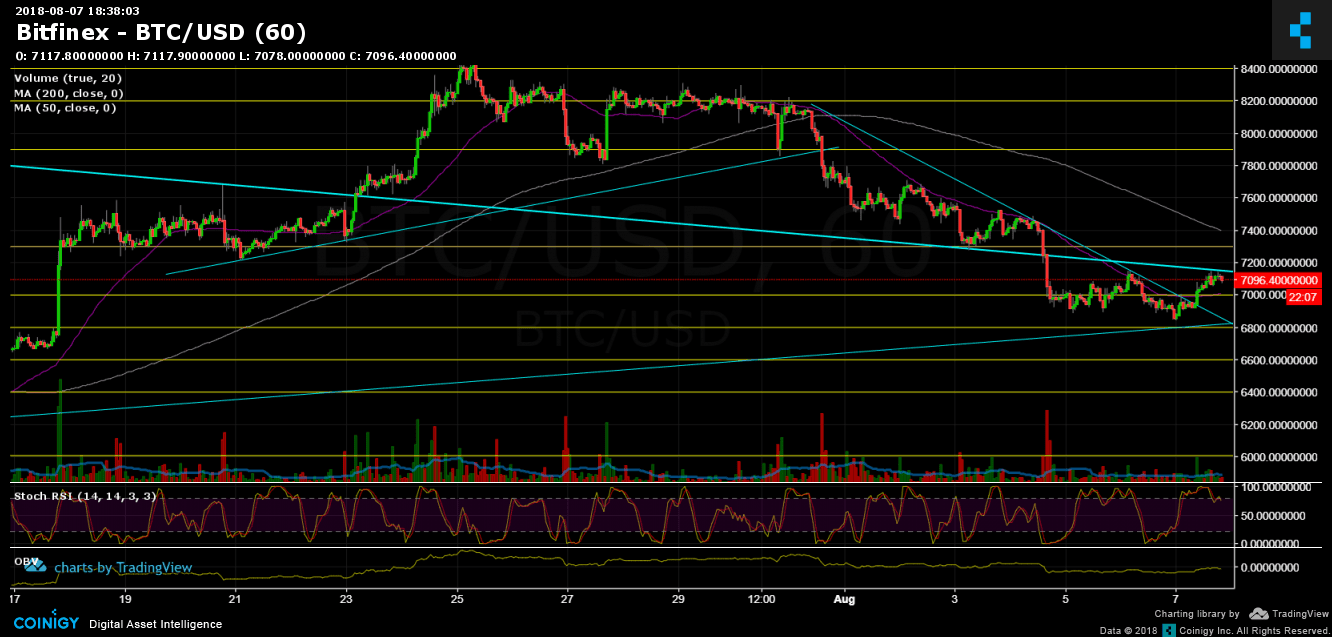
So over the past 48 hours the $6800 important support level have been tested again, and so far seems to hold. Together with breaking up the ascending trending line, Bitcoin had gained some momentum to re-test the long-term descending trend line (marked in bold light blue on the chart below). Breaking it up will likely send Bitcoin to re-test resistance levels at $7300 – $7400 (Moving Average 200 days).
However, Bitcoin is testing resistance as of writing these words, along with the high RSI levels (market is overbought) – we can expect a correction or consolidation till trying to continue the way up. The volume of buyers is still a lot lower than the sellers’ volume levels. The market will stay bearish unless buyers will step in (and create green volume candles).
From the bear side, $7000 is now resistance-turned support, and below stands the important $6800 support area. Next is $6600 support (weaker support level).
Bitcoin Prices: BTC/USD BitFinex 1 Hour chart
Disclaimer: Information found on CryptoPotato is those of writers quoted. It does not represent the opinions of CryptoPotato on whether to buy, sell, or hold any investments. You are advised to conduct your own research before making any investment decisions. Use provided information at your own risk. See Disclaimer for more information.


