

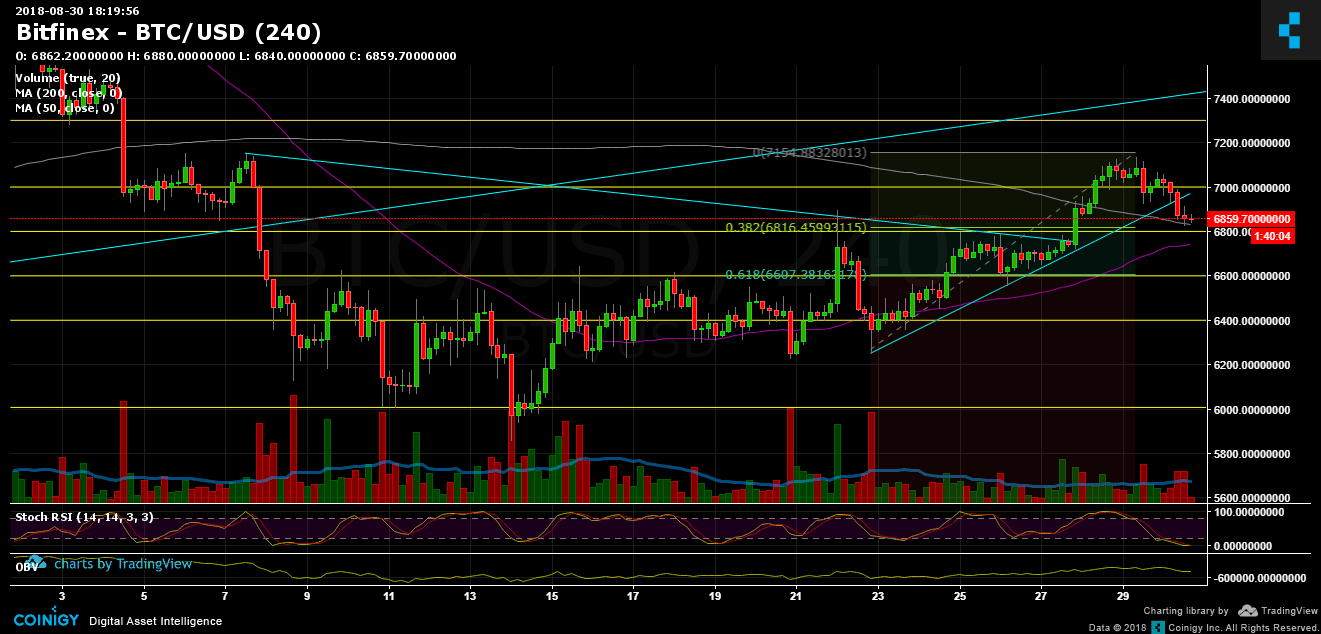
As reported on our previous analysis, market was overbought and needed a correction after testing the $7000 strong resistance zone, where lies the Moving Average 200 days line.
The correction might stop in these areas (~$6800) where there is a resistance-turned support level along with Fibonacci retracement %38.2 level. RSI levels are at low levels, despite Scholastic RSI oscillator hadn’t crossed yet. This supports the option of the market being oversold.
Next major support lies around $6730 (Moving Average 50 days) and then $6600 area (strong support combined with %61.8 Fibonacci retracement level.
Besides the technical analysis, there is a major event tomorrow around 15:00 PM UTC time – the expiration of CME Group’s August 2018 Bitcoin Futures. This event might have a significant effect on the Bitcoin market to either direction.
To sum up
Support levels lie at $6800, $6730 (MA-50 – purple line in the chart), $6600.
Resistance levels lie at $7000, $7250, $7600 (the long-term descending line).
Bitcoin Prices: BTC/USD BitFinex 4 Hours chart
Cryptocurrency charts by TradingView.
Disclaimer: Information found on CryptoPotato is those of writers quoted. It does not represent the opinions of CryptoPotato on whether to buy, sell, or hold any investments. You are advised to conduct your own research before making any investment decisions. Use provided information at your own risk. See Disclaimer for more information.


