

From our previous Bitcoin price analysis: “BTC expecting to produce a fast move to either direction, this is expected to take place in the following 1-2 days.”
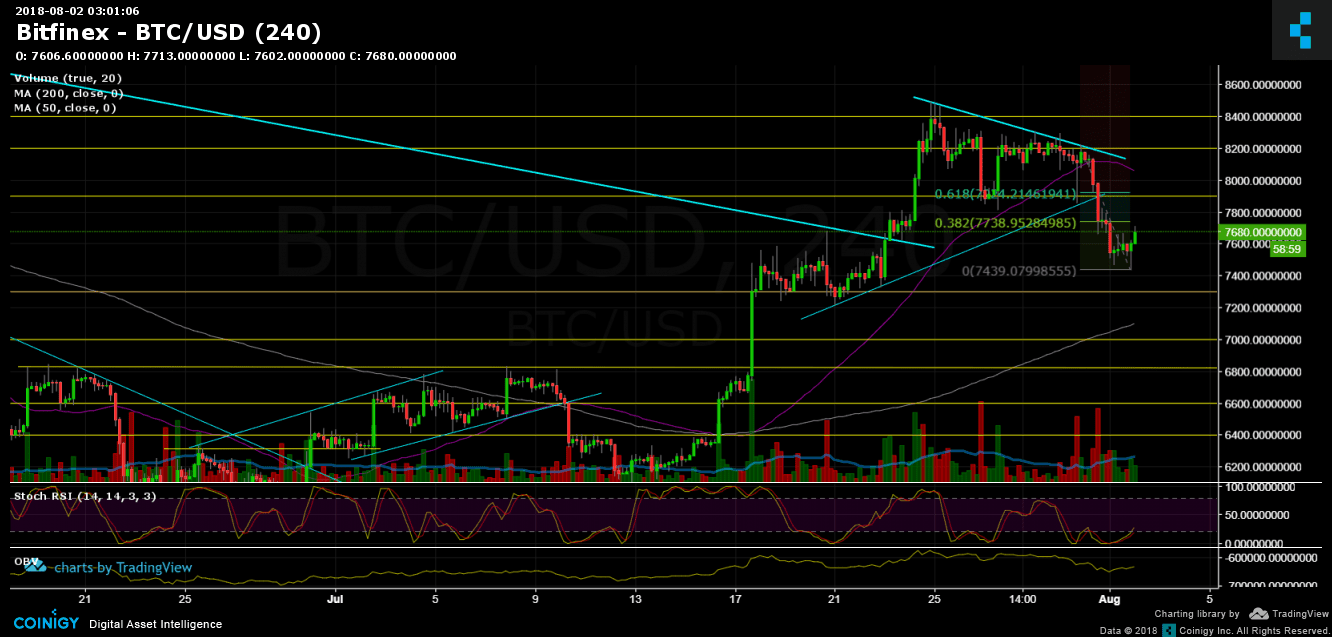
As you all might have seen, the direction was down. The range between $7800 – $8200 had been broken down, the Moving Average 50 days was broken down as well (the last time Bitcoin was below MA-50 was at $6300) the support at $7600 also broke, and the low has been recorded at $7440 (BitFinex). The trigger this time was the hacking of Bithumb.
During recent hours, we see a correction to the decline. According to the chart and to Fibonacci levels – the correction might reach $7700 area (38.2% level) or $7900 zone (61.8%). The overall picture looks negative – the very high seller’s candle also point on that, but all can be changed in case of breaking up the $8000 level again (followed by a decent green trading volume) – where lies the important Moving Average 50 days (purple line in the chart).
To sum up: Support levels lie at $7600 and $7300.
Resistance levels lie at $7800- $8000 zone, $8200.
Bitcoin Prices: BTC/USD BitFinex 4 Hours chart
Disclaimer: Information found on CryptoPotato is those of writers quoted. It does not represent the opinions of CryptoPotato on whether to buy, sell, or hold any investments. You are advised to conduct your own research before making any investment decisions. Use provided information at your own risk. See Disclaimer for more information.


