CryptoPotato
CryptoPotato
  • Crypto News
  • Margin Trading
  • Guides
    • Bitcoin & Crypto Guides 101
    • Bitcoin For Beginners
    • Editorials
  • DeFi & NFT
  • Buy
  • Language
    • Spanish
    • Turkish
    • German
    • Bulgarian
  • Crypto News
  • Bitcoin For Beginners
  • Cryptocurrency Guides 101
  • Editorials
  • Bitcoin & Crypto Margin Trading
  • DeFi & NFT News
  • Bitcoin Price Analysis
  • Ethereum (ETH) Price Analysis
  • Ripple (XRP) Price Analysis
  • Market Updates
  • Interviews
  • Buy Bitcoin with Card
  • CryptoPotato Spanish
  • CryptoPotato Turkey
  • CryptoPotato Germany
  • CryptoPotato Bulgaria
  • Market Updates
  • BTC Analysis
  • ETH Analysis
  • XRP Analysis
  • Interviews
CryptoPotato
CryptoPotato
  • Crypto News
  • Margin Trading
  • Guides
    • Bitcoin & Crypto Guides 101
    • Bitcoin For Beginners
    • Editorials
  • DeFi & NFT
  • Buy
  • Language
    • Spanish
    • Turkish
    • German
    • Bulgarian
  • Crypto News
  • Bitcoin For Beginners
  • Cryptocurrency Guides 101
  • Editorials
  • Bitcoin & Crypto Margin Trading
  • DeFi & NFT News
  • Bitcoin Price Analysis
  • Ethereum (ETH) Price Analysis
  • Ripple (XRP) Price Analysis
  • Market Updates
  • Interviews
  • Buy Bitcoin with Card
  • CryptoPotato Spanish
  • CryptoPotato Turkey
  • CryptoPotato Germany
  • CryptoPotato Bulgaria
Home » BTC » Bitcoin Price Analysis: After Correcting, BTC Faces the Critical 200-MA Again

Bitcoin Price Analysis: After Correcting, BTC Faces the Critical 200-MA Again

Author: DanBTC916

Last Updated Aug 13, 2021 @ 11:43
Getting your audio player ready...

The bearish divergence appearing on the BTC 4-hour chart for the past week managed to form a local top at $46.7k. BTC fell to a near-term low at $43.8k, finding support just above a key downtrend.

img1_btc-min
Chart by TradingView

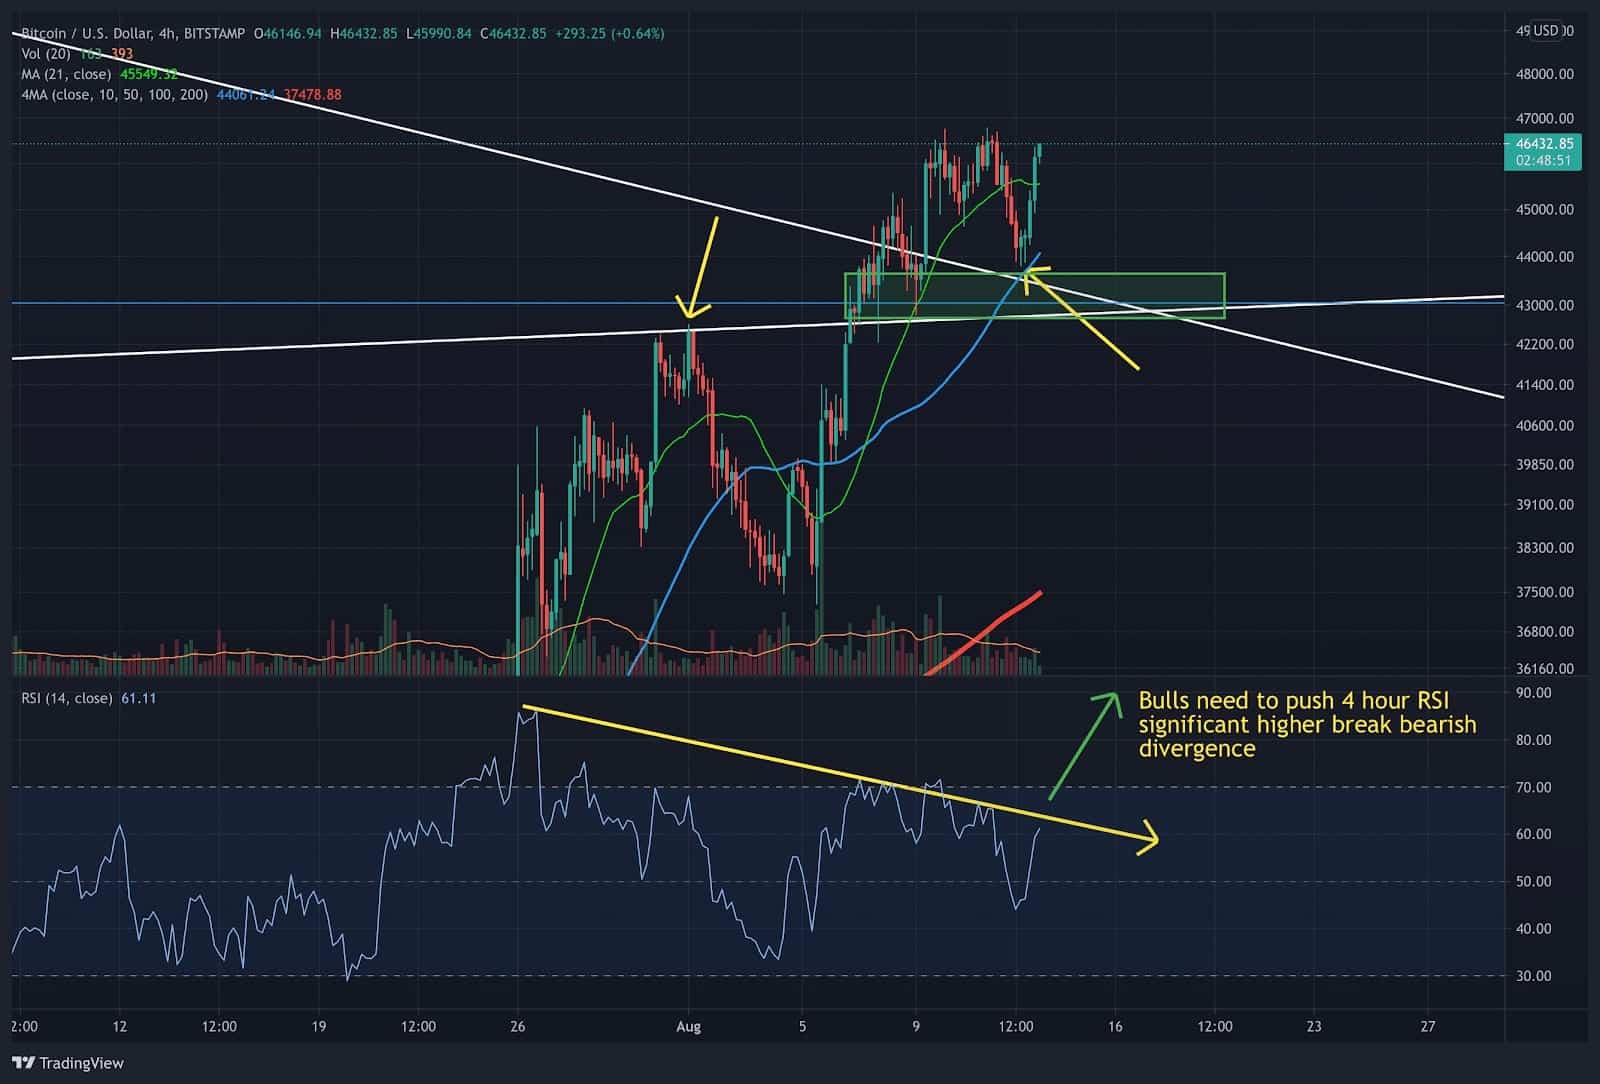
As we reported earlier, the recent dip below the 200-day moving average puts BTC in a tight spot as it is important to see a strong weekly close above that level. Making a weekly close above it, alongside the 21-week moving average, will flash a very bullish technical buy signal of the re-entry into bull market continuation. So far, it’s good to see BTC find support at the downtrend line, with a push back above the 200-day moving average.

What Happened During the Pullback?

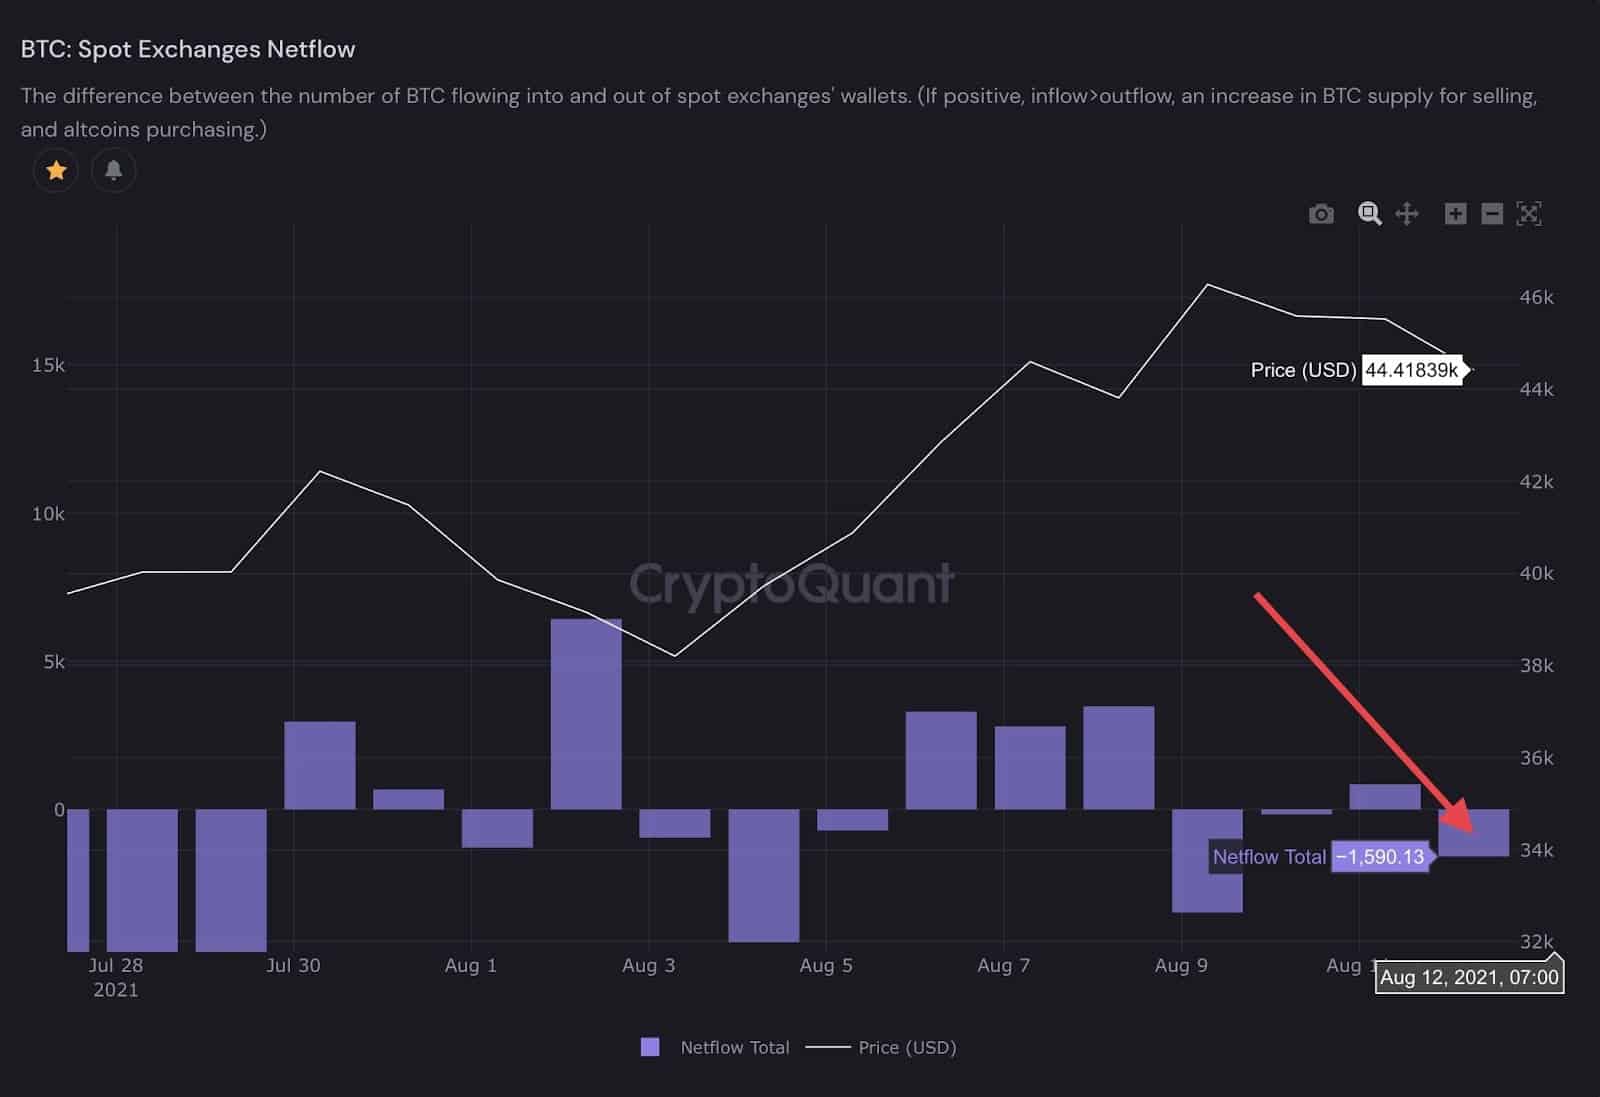
The near-term pullback had less aggregate spot volume, signaling weak selling pressure. Most importantly, on-chain data by CryptoQuant showed consistent spot exchange outflows, no major build-up in exchange reserves, no major signal of large entities selling, with miner reserves continuing to increase. This strongly suggests that the weak hands got flushed out, as shown by the long liquidations on derivative platforms.

drag-drop-file-0-min (1)
Chart by CryptoQuant
drag-drop-file-2-min
Chart by CryptoQuant

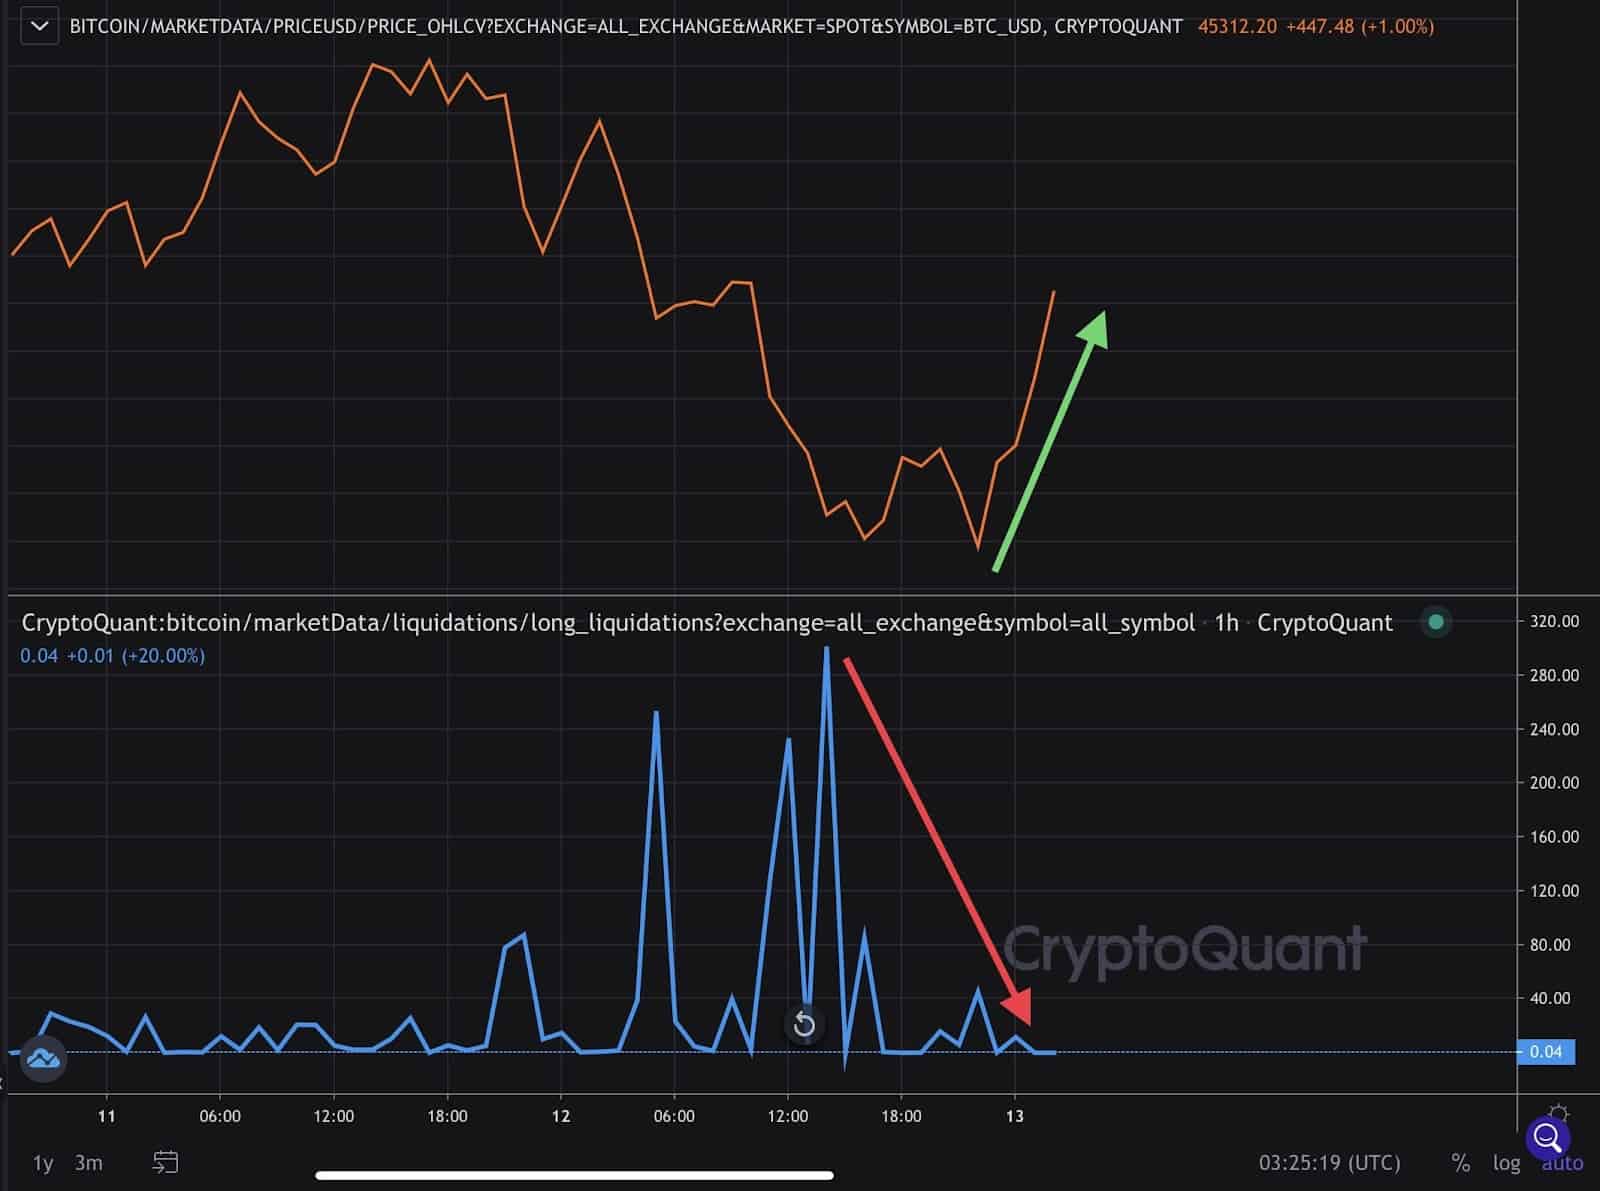
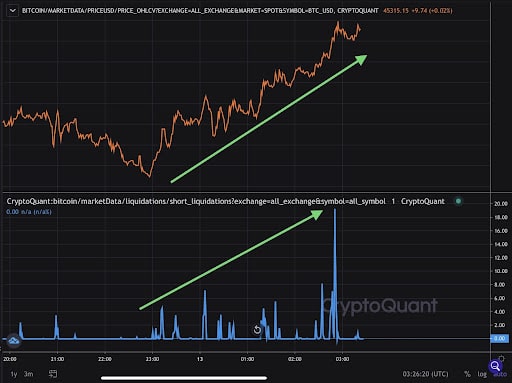
Long liquidations increased as BTC fell but eventually cooled off as short positions began piling on. Earlier today, BTC started pushing higher, and shorts began to get liquidated by the hour.

img2-min (2)
Chart by CryptoQuant

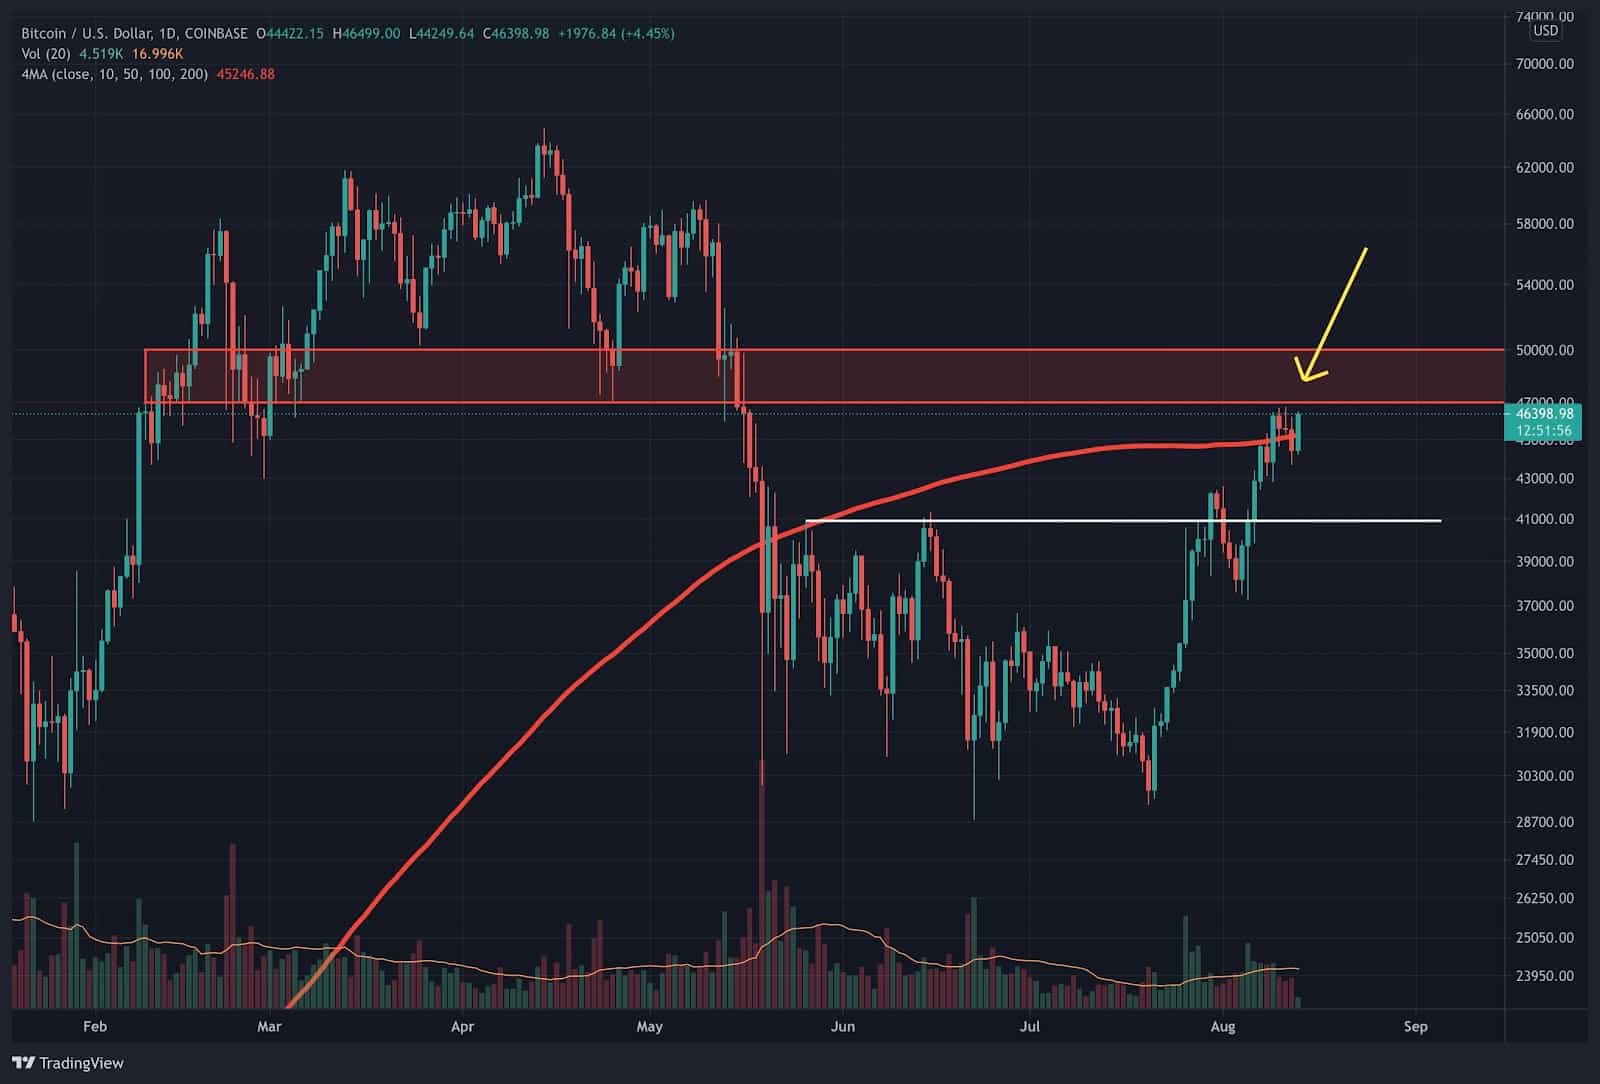
BTC Price Holds Support, What to Expect Next

For the near term, BTC is attempting to retest the local highs at $46.7k – a key level to close above. The 4-hour chart is still showing bearish divergence for the past week, but the relative strength index is slowly approaching the downtrend line as the near-term correction appears to be concluding.

Ideally, the bulls need to see a push above the local high at $46.7k to accelerate momentum to drive BTC towards the next major zone between $47k to $50k. On-chain analysis shows a moderate amount of realized price distribution in this range. The charts also show trading volume occurring between $47k to $50k. This suggests that a bit of supply could enter the market as investors in this range could be looking to break even.

drag-drop-file-0 (1)-min
Chart by TradingView

If buying pressure on spot exchanges can absorb this potential incoming supply and shorts in denial continue to get squeezed, this could be the setup that helps BTC break above $50k, turning the technicals even more bullish on a higher time frame.

In the next 24 hours, if BTC can close at the highs, the 3-day close could flash another bullish pulse, and momentum will be getting one step closer to flashing a longer-term buy signal.

BTC bears have been arguing the rally to the 200-day moving average is a bull trap and that whales will use this as an opportunity to dump on retail. So far, on-chain data has contradicted this prediction, instead showing further accumulation and spot buying activity, something critical in a recovery phase after BTC dropped more than 55% from all-time highs.

There is still plenty of work for BTC to do to show price confirmation on the charts. Overall, the on-chain data continues to show strength, and momentum is trending higher. A long-term buy signal has flashed on the hash ribbons, and near-term support has held. The long-term outlook remains bullish, BTC bulls just need price confirmation for continuation.

SPECIAL OFFER (Sponsored)
Binance Free $600 (CryptoPotato Exclusive): Use this link to register a new account and receive $600 exclusive welcome offer on Binance (full details).

LIMITED OFFER for CryptoPotato readers at Bybit: Use this link to register and open a $500 FREE position on any coin!


Disclaimer: Information found on CryptoPotato is those of writers quoted. It does not represent the opinions of CryptoPotato on whether to buy, sell, or hold any investments. You are advised to conduct your own research before making any investment decisions. Use provided information at your own risk. See Disclaimer for more information.

Cryptocurrency charts by TradingView.
Enjoy reading? Share with your friends
Facebook Twitter LinkedIn Telegram

About The Author

DanBTC916
More posts by this author

Dan is a cryptocurrency Onchain/Technical analyst at a Crypto Fund with 11 years of experience in equity markets and over 4 years in crypto markets. Dan’s background and deep understanding of Finance and Economics have sparked a deep passion for the cryptocurrency markets, especially in Bitcoin. Follow Dan on Twitter

Join Our Community

FacebookX YouTubeTelegram


Editorials
How to Farm Airdrops on Hyperliquid (HYPE): The Complete Guide to Free Money This Crypto Cycle

How to Farm Airdrops on Hyperliquid (HYPE): The Complete Guide to Free Money This Crypto Cycle

How to Trade on Hyperliquid: The Ultimate Guide (Step-by-Step Walkthrough)

How to Trade on Hyperliquid: The Ultimate Guide (Step-by-Step Walkthrough)

12 Best Meme Coins to Watch in July 2025

12 Best Meme Coins to Watch in July 2025

7 Best Meme Coin Presales to Watch in July 2025

7 Best Meme Coin Presales to Watch in July 2025

Toobit Review 2025: Is Toobit a Safe Crypto Exchange?

Toobit Review 2025: Is Toobit a Safe Crypto Exchange?

Hyperliquid Bridge: How to Bridge USDC to Hyperliquid

Hyperliquid Bridge: How to Bridge USDC to Hyperliquid

10 Best Crypto Presales to Consider in July 2025

10 Best Crypto Presales to Consider in July 2025

Join Our Newsletter
Become a CryptoPotato VIP
One Weekly Email Can Change Your Crypto Life.
Sign-up FREE to receive our extended weekly market update and coin analysis report
We NEVER send spam. You can unsubscribe at any time.
Invalid email address
Thanks for subscribing!
Footer Logo
About
Advertise on CryptoPotato
About Us | Contact Us | Careers
Editorial Policy
Terms of service | Privacy Policy | GDPR
More Sections
IEO List | Evaluations
Airdrops
Scholarship
Disclaimer
Disclaimer: Information found on CryptoPotato is those of writers quoted. It does not represent the opinions of CryptoPotato on whether to buy, sell, or hold any investments. You are advised to conduct your own research before making any investment decisions. Use provided information at your own risk. Full disclaimer
© Copyright CryptoPotato 2016 - 2025
Scroll to top
One Daily Email Can Change Your Crypto Life.

Sign-up FREE to receive our extended daily market update and coin analysis report

We never send SPAM. You can unsubscribe at any moment
Invalid email address
Thanks for subscribing!